
D&D&R Chapter 1: Roll Stats
Hello everyone, welcome back and let’s just roll into this
We already know I have a passion for board games, but something I haven’t quite blasted on here is my love of Dungeons and Dragons. It is easy to say the game has become a cornerstone of my life in the past few years. There is something I love about how the game just feels dominated by chance yet influenced by calculated risk. I thought to myself, this balancing act would be a perfect vehicle to perform some exploratory analysis on.
Just a few things I want to mention before we get started. First, I am going to be using the dice package in R. This is a wonderful package by Dylan Arena which made, I had a lot of fun using and evenmore so, can be used for a wide range of other dice probability. I am already working on another project with a game called “Dice Throne”.
library(dice)
Also, throughout most of this project, you will hear me say things like d6 or 2d8. For those of you who arent rich in nerd nomenclature, in the phrase xdy:
- x = Number of die
- d = Dice
- y = The number of sides on that die So the phrase 2d6 would mean two- six sided die
With so many aspects to explore, this is going to be a multipart project . As thus, let our journey begin…
Introduction
At the roots of any D&D campaign, there is a player and their character. The players act out the life and times of these characters and the DM narrates the events as they unfold. Most campaigns don’t start at the literal birth of a character, but rather introduce them at various parts of their life. That being said, it’s up to players to determine how their characters interact with their world, and to do that they use metrics. These metrics are known as Ability Scores. Six scores: Strength, Dexterity, Wisdom, Intelligence, Constitution, and Charisma act as a gauge to measure how good a character is at several aspects of their life.
When creating a character, the player has many options in determining their Ability Score. However, no matter how which option you choose, there are generally two methods used. In one method you have a collection of points and you assign those points to Ability scores. This options in this method typically differ in how many points you start with or how many points you’re allowed to distribute in a given ability. The other method involves rolling dice to determine the amount of points you get. Like before, the only real difference in options used in this method is how many dice you roll or how values are derived from the dice.
I am going to take a look into one option in each method, described in the Player’s Handbook(PBH). One option is called the “Simple Point”. In this method you have a stat score of 15,14,13,12,10, and 8. You can attribute those points to any score you’d like and the result is you’re character’s Ability Scores. In this method you don’t distribute a bulk of points, instead you have predefined numbers and you direct them to a location. The positives of this method are:
- These are stable numbers, and because of how ability modifiers are dervived from those scores your character would only be terrible at 2 Ability, Mediocre at 2, decent at 1, and great at 1.
- With finishing a character’s creation(selecting their playable race and class), you can shift these rankings around to be great at 2, or decent at 3, or mediocre at most, ect…
When compared to rolling methods, this may seem like a much more reliable way to get good stats however, how would you feel if I were to tell you, the odds are in your favor to avoid a score that I would rank as bad(The 8 and 10)? I am going to do better than just tell you, I am going to show you:
The most general way the PBH uses the “roll point” method is as follows:
- Roll a d6 4 times
- Sum the total of the 3 highest rolls(discarding the lowest)
- Record results and repeat steps 1 through 3 until you have recorded 6 sums
- Assign a sum to each Ability Score.
This style is both loved and feared by players because it allows for you to create really dynamic characters but has the same potential to create heroes of colossal incompetence. However, I computed the probability of using this method and visualized how Ability Scores are distributed.
# Using the getSumProbs function from the "dice" package I was able to calculate the probability of the this method
Player_Roll_Stats <- getSumProbs(ndicePerRoll = 4, # Tells the function to roll 4 dice(Rule 1)
                              nsidesPerDie = 6, # Numer of sides per dice
                              nkept = 3) # This tells the function to only keep the 3 highest numbers(Rule 2)
I decided to take it a step futher and visualize this:
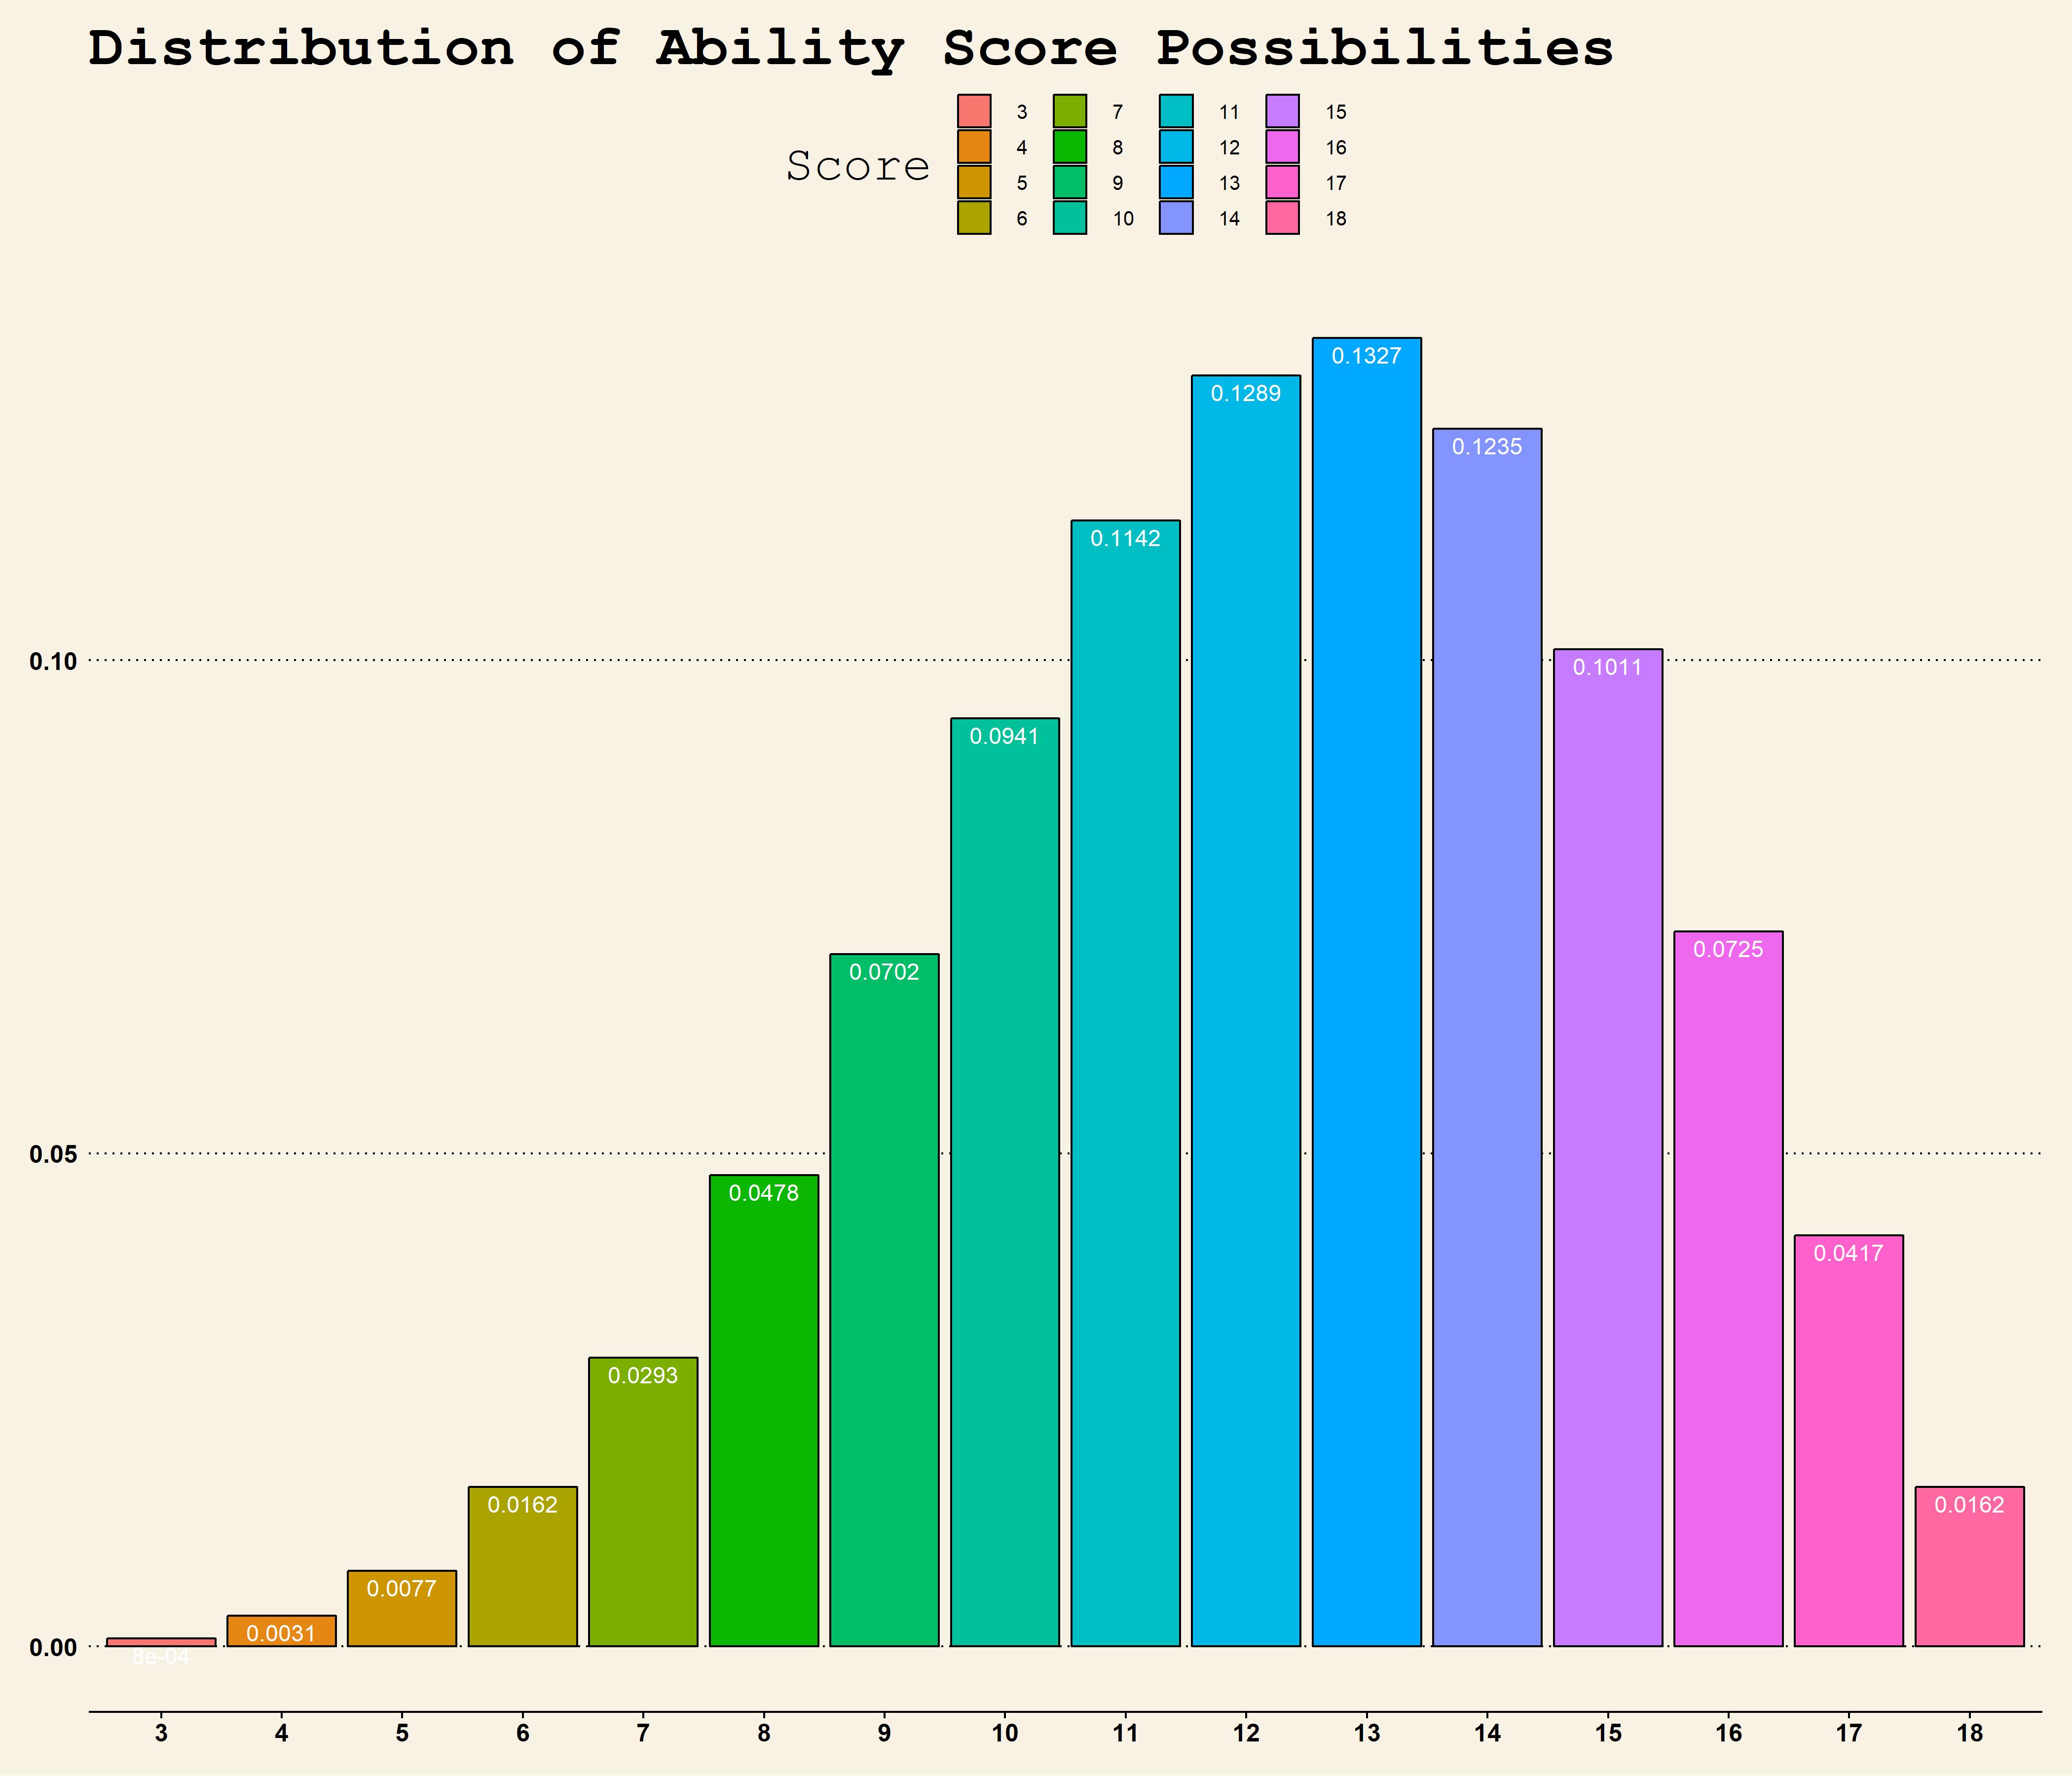
You can see that you actually have the highest chances of rolling a 14,13, or 12. If you look at the “simple stats” 15,14,13,12,10, and 8 it looks like they give you two values on the lower end of the spectrum(8 and 10) eventhough you have a much higher chance of rolling the higher stat totals multiple times. Remember these are all independent so while it is hard to pull off, I would argue that its mathematically easier to roll multiple 12’s,13’s, and 14’s, than it is to roll 8’s,9’s, and 10’s
I thought about this and decided to put my money where my mouth was. I pulled together character stats rolled up from some of my party memeber(you guys are the best!) and compared them to a hypothetical character who used the simple buy method.
head(Characters_Stats)
ggplot(data = Characters_Stats, aes(x = Character, y = Stats_Total, fill = Percent_Change)) +
  geom_bar(stat = "identity")
# Just to make things neater and more appealing visually I am going to do some work
# First I am going to change the order, since I want you to focus on comparing this to the Simple points character I am going to make the
# Graph show a gradient
Characters_Stats$Character<- factor(Characters_Stats$Character, levels = c("Simple_Point","Clair","Dewberry","Faylen","Ghidrah","Trappist","Goliath","Gruit","Vanessa"))
# Now lets build this graph up
CSG<- ggplot(data = Characters_Stats, aes(x = Character, y = Stats_Total, fill = Percent_Change)) +
  geom_bar(stat = "identity")+
  geom_text(aes(label=Percent_Change),vjust=1.5, color= "white")+
  labs(title = "Character Stat Totals Compared  \nto a Simple point Character", x = "Characters", y = "Ability Score Total")+
  theme(plot.title = element_text(size = 15, hjust = 0.5),
        legend.background = element_rect(color = "black", size =  .5),
        panel.grid.major = element_blank(),
        panel.grid.minor = element_blank(),
        panel.border = element_rect(color = "black", fill = NA))
CSG
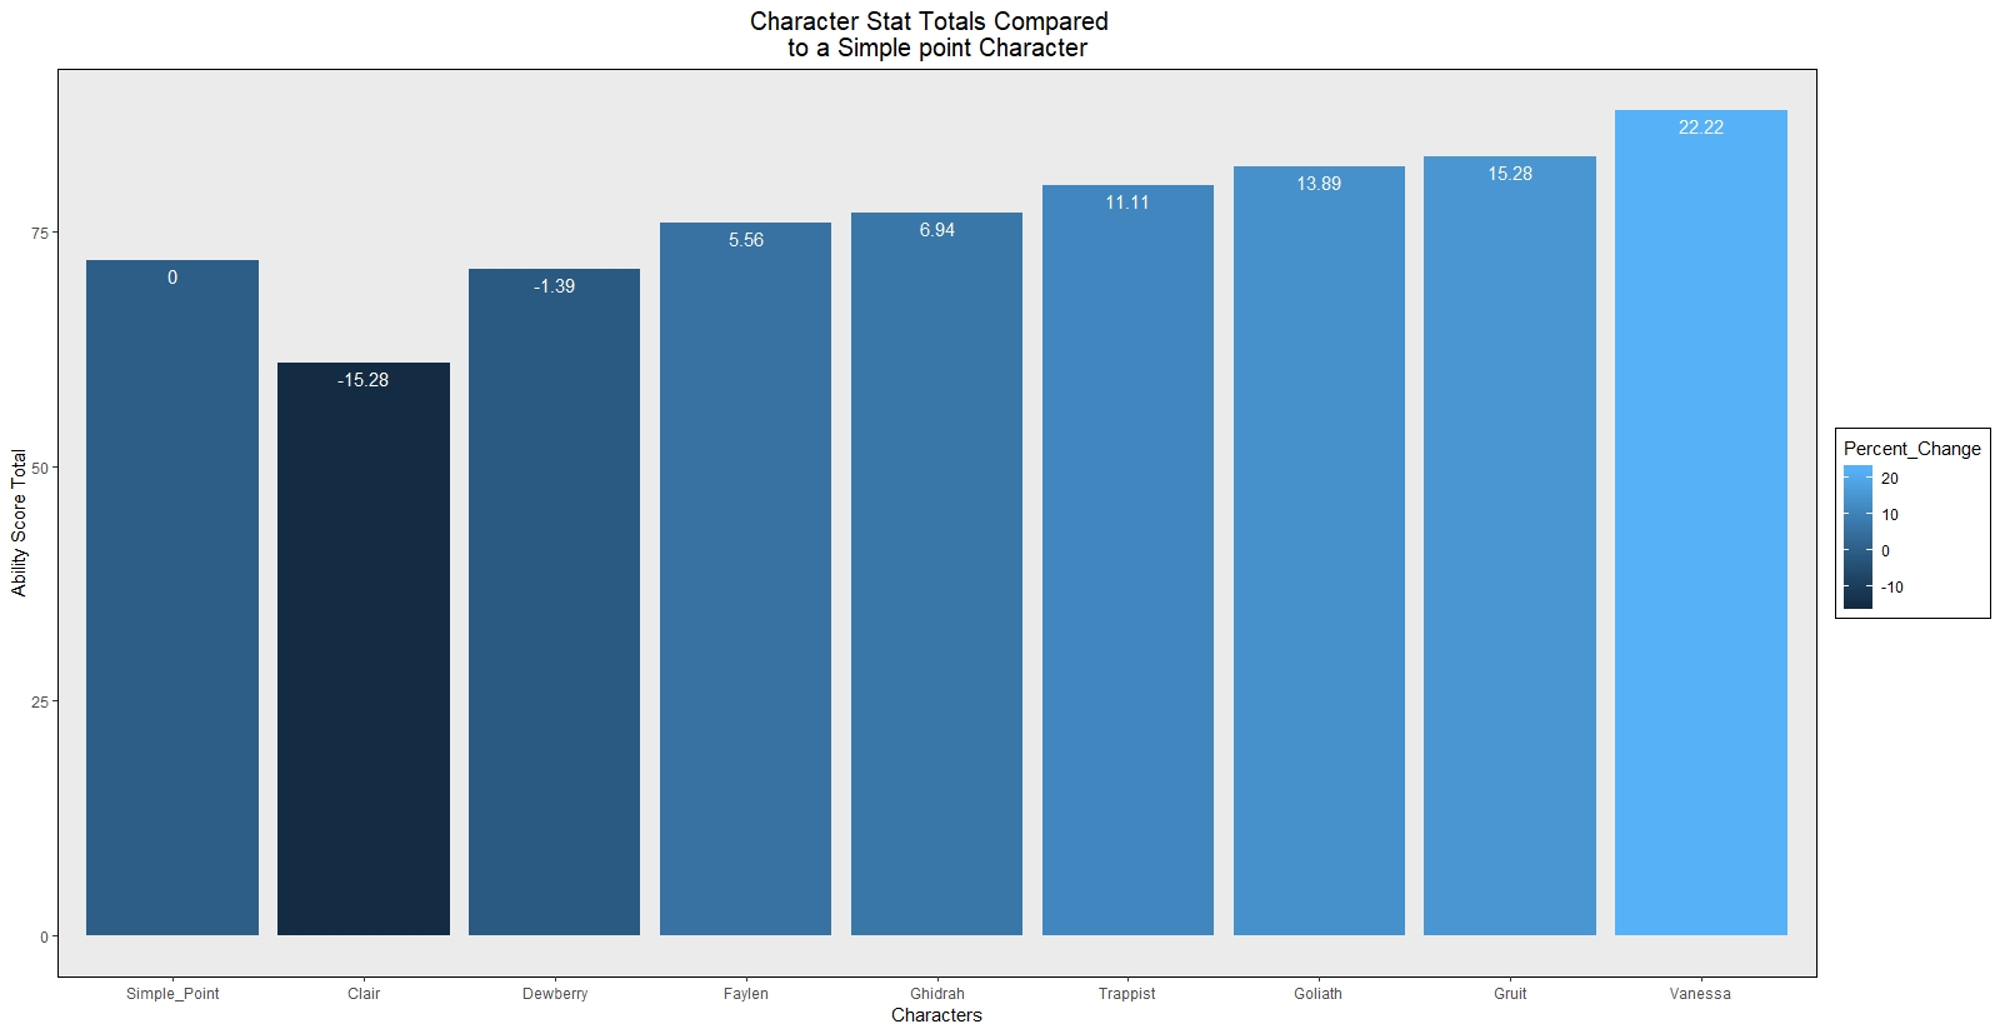
For those of you who think “Only having 8 characters isn’t a fair sample size to compare to” to you my retort would be: You are absolutly right, please @ me some data!!!! Serieously!!!
The post in this series isn’t nessesarly about proving anything. The main purpose of this series is to show the effect of how probability plays a roll in the game of Dungeons and Dragons. I hope you enjoyed the start of this series. See you guys